Technical brief · June 2026 · Ethiopia
This brief highlights activities and lessons learned from implementing the Pharmaceutical Supply Chain and Pharmacy Services Excellence Maturity Framework through the Targeted Support Team (TST) approach under the USG Supply Chain Strengthening (SCS) Project in Ethiopia.
Project: United States Government (USG)–supported Supply Chain Strengthening (SCS) Project
Country: Ethiopia
Implementing partners: Management Sciences for Health (MSH) — Prime Implementer; U3 SystemsWork Int. — Subcontractor and Sub-national Technical Lead
Background
Pharmaceutical supply chain systems and pharmacy services are essential for ensuring the continuous availability, appropriate use, and effective management of quality medicines. Despite notable progress in Ethiopia, health facilities continue to face challenges including medicine stock-outs and overstocking, weak inventory management, limited use of logistics data for decision-making, poor LMIS reporting quality and timeliness, inadequate adherence to standard operating procedures, insufficient staff capacity, and variability in service standards across facilities.
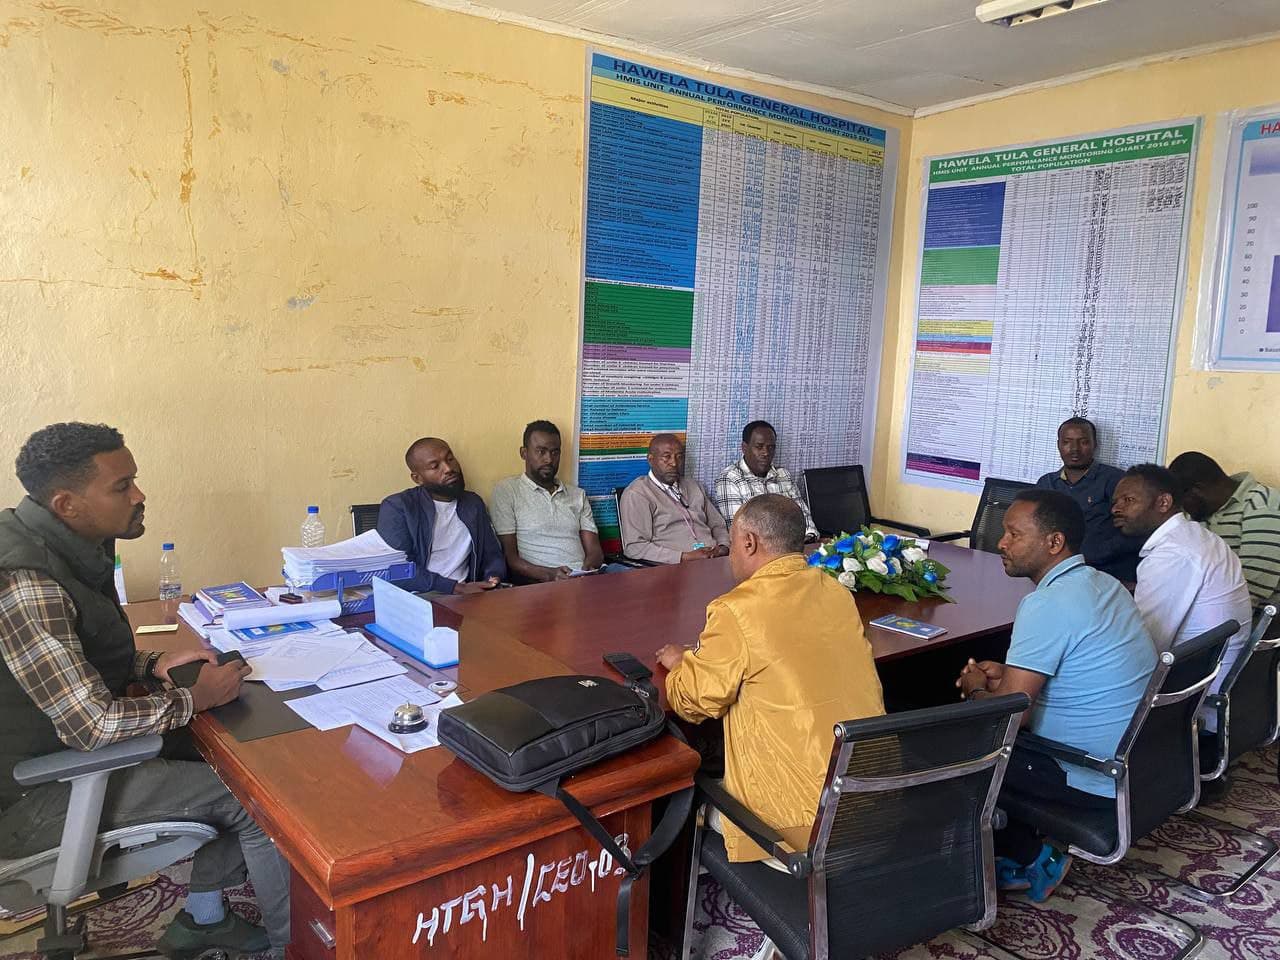
The Federal Ministry of Health (FMoH), in collaboration with Regional Health Bureaus (RHBs), implementing partners, and the USG-funded SCS Project implemented by MSH and subnational partner U3 SystemsWork International, introduced the Excellence Maturity Framework supported by a Targeted Support Team (TST) approach. The framework provides a structured roadmap for assessing, monitoring, and improving facility performance, while TSTs deliver onsite assessment, mentorship, coaching, supportive supervision, and joint action planning.
Problem statement
Facilities faced stock-outs, weak inventory and stock control, limited use of logistics data, poor LMIS reporting quality and timeliness, inconsistent pharmacy service standards, and inadequate SOP adherence. Limited supervisory capacity and fragmented technical support constrained facilities’ ability to close performance gaps, contributing to uneven performance, reduced medicine availability, and suboptimal pharmacy service quality.
Stakeholder engagement
USG provided funding and strategic oversight; FMoH provided policy guidance and leadership; RHBs and subnational structures provided implementation oversight. Health facilities owned improvement actions and performance monitoring. MSH led technical direction and project management; U3 SystemsWork International provided subnational technical leadership, coordination, and field-level assistance. Federal and regional TSTs served as the field implementation arm for assessments, coaching, mentorship, data validation, and continuous technical support.
Objective
To strengthen pharmaceutical supply chain systems and pharmacy services in health facilities through implementation of the Excellence Maturity Framework using a Targeted Support Team (TST) approach.
Methodology
The intervention combined a TST model with maturity-based facility classification to guide allocation of technical assistance. Facilities were assessed and categorized by performance and readiness, then supported through regular multidisciplinary on-site visits for coaching, performance data review, and improvement-plan implementation. Indicators were monitored using routine data and supervision tools, in close collaboration with FMoH, RHBs, MSH, U3, and facility teams.
Technical approach
Integration of the maturity framework and TST model
The Excellence Maturity Framework assesses and improves facility performance across key supply chain and pharmacy service areas. It is operationalized through TSTs that deliver targeted, data-driven, continuous technical assistance — establishing a continuous improvement system that helps facilities progress through defined maturity levels.
Establishment and core functions of TSTs
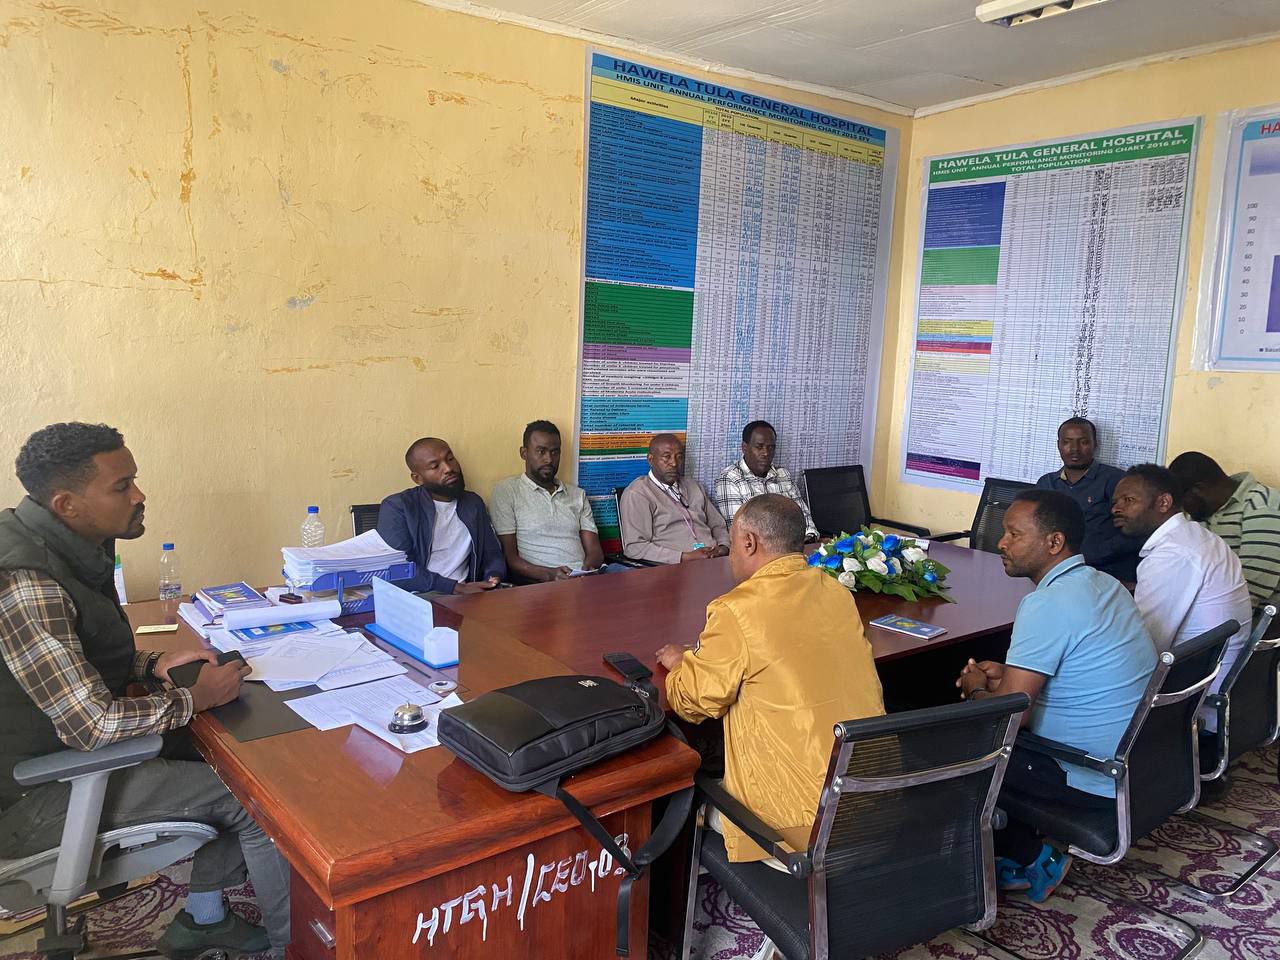
FMoH, RHBs, MSH, and U3 established multidisciplinary TSTs of pharmacy and supply chain experts, deployed across geographic clusters. TSTs conduct baseline and follow-up assessments; provide onsite coaching, mentorship, and technical assistance; support facility improvement plans; validate logistics and pharmacy data; identify bottlenecks and escalate critical issues; and monitor progress. They operate as continuous improvement agents rather than traditional inspection teams.
Facility assessment and maturity classification
Assessments used standardized tools derived from the Excellence Maturity Framework, covering inventory management; storage and FEFO/FIFO adherence; LMIS data quality, completeness, and timeliness; ordering and requisition; pharmacy service standards; leadership and governance; and 13 core modules of the Ethiopian pharmaceutical and supply chain system, plus emergency preparedness and program-specific considerations.
Table 1. Maturity level classifications
| Level of maturity | Definition | Maximum contribution to the CMM score |
|---|---|---|
| Basic | These are the must-have policies, structures, processes, procedures, tools, indicators, reports, and resources to operate a supply chain system (e.g. a stock card as a tool for inventory management). | 50% |
| Intermediate | These are not must-haves but are intermediate level policies, structures, processes, procedures, tools, indicators (e.g. an excel sheet). | 30% |
| Advanced | These are nice-to-have policies, structures, processes, procedures, tools, indicators, reports, and resources to operate a supply chain system (e.g. Rx solution, a dispensing and stock management electronic tool). | 15% |
| State of the Art | These are non-essential, state-of-the-art policies, structures, processes, procedures, tools, indicators, reports, and resources for a supply chain system (e.g., an Enterprise Resource Planning system for stock management and control). | 5% |
Classification informed the intensity and focus of TST support. Joint improvement plans outlined gaps, corrective actions, responsibilities, timelines, and follow-up. Support covered inventory and stock control, LMIS data quality, forecasting and ordering, pharmacy services and counseling, storage management, and leadership — with lower-performing facilities receiving more frequent engagement.
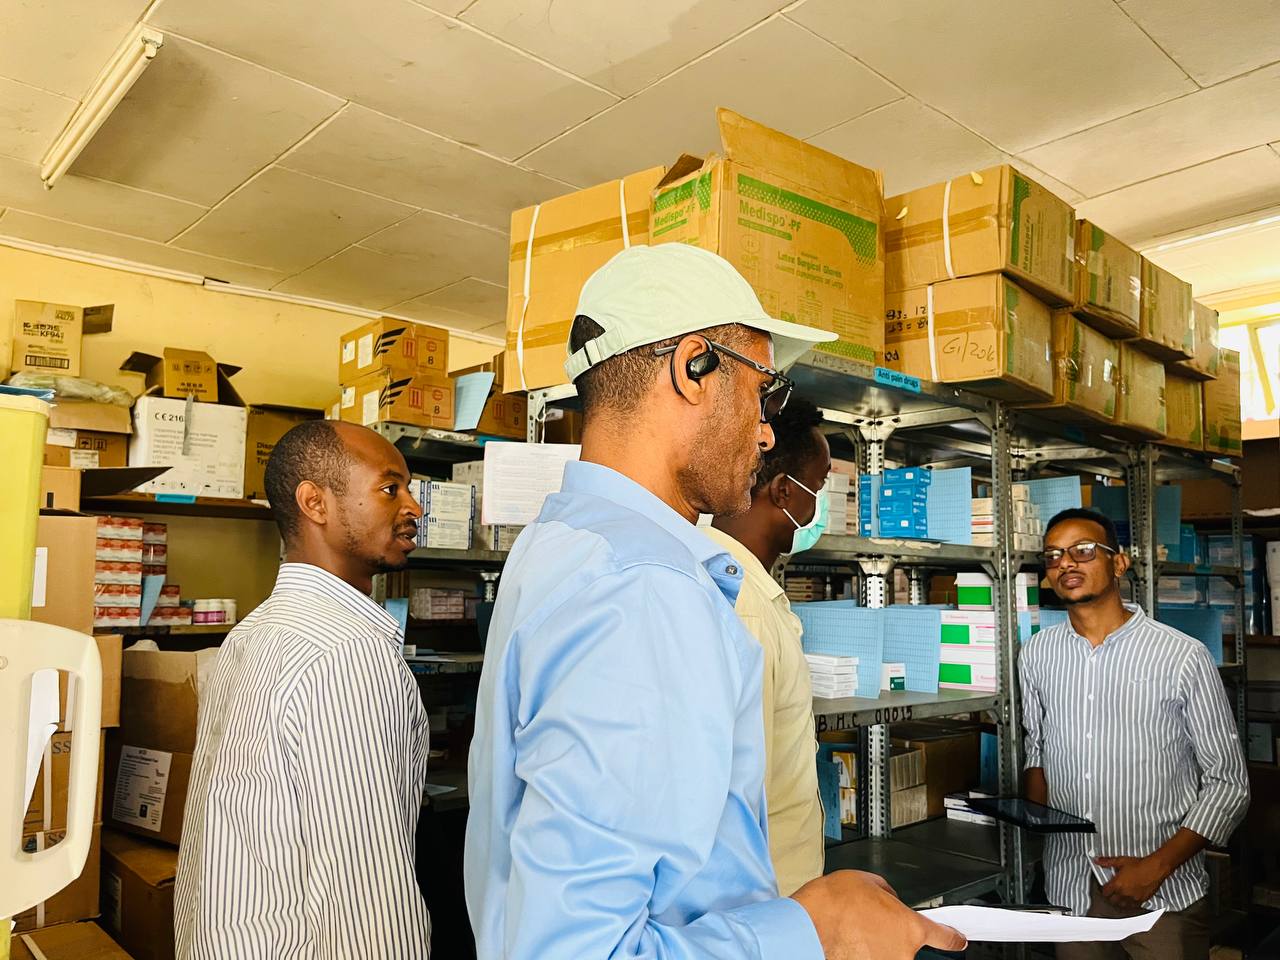
TSTs utilized standardized monitoring tools and performance dashboards to track key indicators, including medicine availability, reporting completeness and timeliness, inventory accuracy, pharmacy service quality indicators, implementation of improvement plans, and progression across maturity levels.
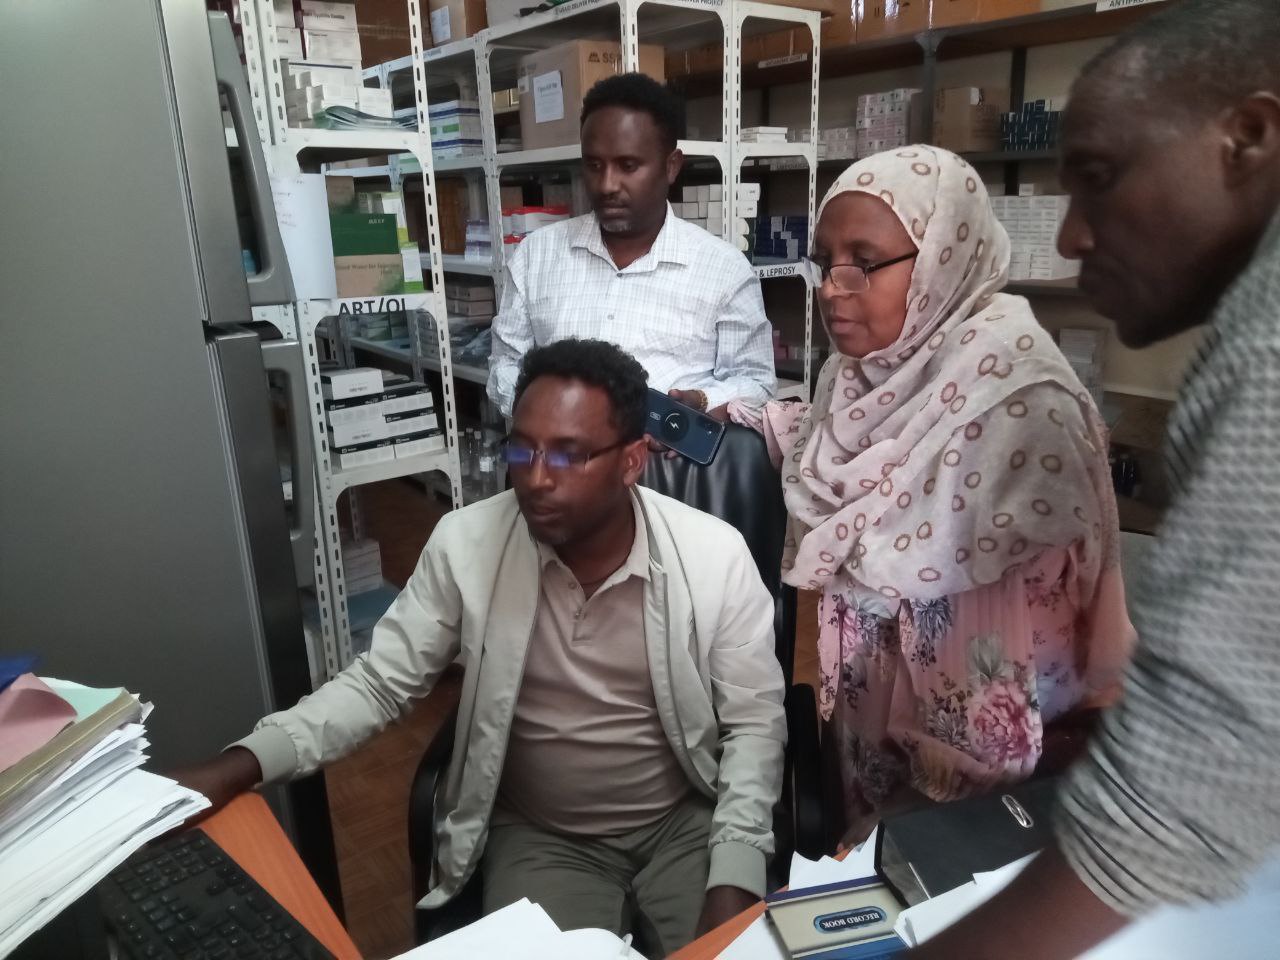
The continuous improvement cycle was: Assessment → Planning → Implementation → Monitoring → Reassessment.
Results and achievements
The TST approach produced measurable gains, including increased availability of essential medicines and priority commodities (including VL/EID supplies); improved inventory accuracy and stock management; enhanced LMIS reporting completeness and timeliness; stronger pharmacy service delivery and patient counseling; greater facility ownership of supply chain processes; and improved coordination with subnational structures.
Baseline assessment findings
A baseline assessment covered 401 USG-SCS supported health facilities (185 hospitals and 216 health centers, including federal hospitals) across 14 regions, 65 ZHDs, and 149 WoHOs using the NSCPSA Capability Maturity Model. No module reached the 80% maturity benchmark. Relatively stronger areas included Forecasting and Supply Planning (76–77%) and Financial Sustainability (70–73%). Performance indicators showed 55% storage compliance, 68% inventory accuracy, 28% good dispensing practices, and 41% functional DAGU systems — despite high commodity availability (89–92%). These findings guided TST deployment for mentorship, supervision, and capacity building.
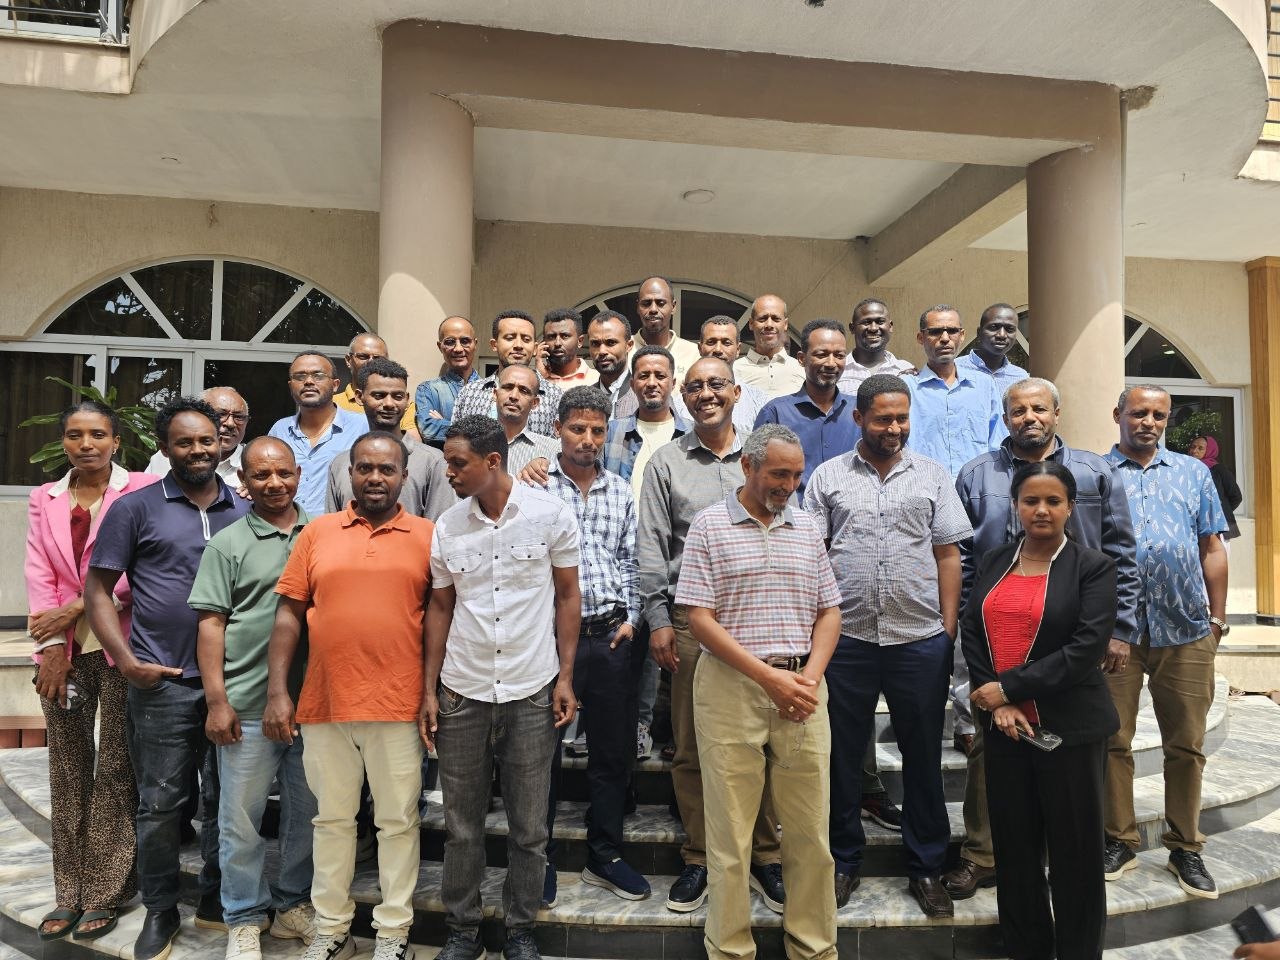
Capability maturity improvements (baseline → FY26 QIII)
Overall capability maturity improved across modules between baseline (January 2026) and QIII (June 2026), with notable gains in pharmacovigilance, logistics management, warehouse and storage, and pharmacy services. Progress in Strategic Planning and Management and Procurement remained more limited, as these require broader system-level interventions and resources. Forecasting and Supply Planning improved substantially, driven in part by the CDSS initiative and strong leadership ownership.
Table 2. TST interventions and results by module
| Module | Key TST interventions | Key results (Baseline → FY26 Q3) |
|---|---|---|
| Human Resources | Mentorship on workforce management, supportive supervision, and corrective action follow-up. | Trained staff database: 42% → 59%; Staff receiving supportive supervision: 88% → 95%; Corrective actions implemented: 73% → 90%. |
| Financial Sustainability | Coaching on financial reporting and accountability practices. | Regular financial reporting: 58% → 84%. |
| Policy and Governance | Support for governance structures, committees, and implementation of standards and guidelines. | Oversight committees: 67% → 77%; Availability of STGs: 86% → 97%. |
| Quality & Pharmacovigilance | Training, mentorship, and provision of SOPs and guidelines for pharmacovigilance and quality assurance. | Quality assurance guidelines: 18% → 59%; PV units established: 35% → 62%; PV SOPs: 30% → 61%. |
| Warehouse & Storage | Coaching on inventory management, storage standards, and stock record maintenance. | Storage SOPs: 69% → 85%; Updated bin cards: 71% → 87%; Temperature recording: 41% → 55%. |
| Distribution | Support on transportation monitoring and cold-chain management. | Temperature monitoring during transportation: 17% → 36%. |
| Logistics Management Information System (LMIS) | Capacity building on LMIS governance, data management, and data quality improvement. | Paper-based LMIS policies: 79% → 93%; Electronic LMIS policies: 37% → 60%; Internal DQA: 24% → 33%. |
| Waste Management | Reinforcement of pharmaceutical waste segregation and disposal practices. | Proper separation of unusable products: 89% → 91%. |
| Pharmacy Services | Mentorship on DTC functionality, clinical pharmacy, DIS, ASP, patient counseling, and APTS implementation. | DTC establishment: 95% → 96%; Pharmacy rounds: 61% → 64%; DIS SOPs: 24% → 94%; DIS reports: 13% → 55%; ASP teams: 37% → 49%; Patient knowledge assessment: 28% → 41%; APTS workflow: 92% → 97%. |
| Emergency Supply Chain | Support for emergency preparedness and coordination mechanisms. | Facilities with emergency supply chain focal persons/teams: 22% → 46%. |
Table 3. Changes on selected parameters with the maturity module
| Module | Improved areas | Baseline, Jan 2026 | QIII, June 2026 |
|---|---|---|---|
| HR | Database to keep track of trained staff | 42% | 59% |
| Facility’s supply chain and PS staff received supportive supervision | 88% | 95% | |
| Corrective actions taken following supervision visits | 73% | 90% | |
| FS | Regularly prepare and submit Financial Reports | 58% | 84% |
| PG | High-level body or committee that provides oversight and Governance for the supply chain and PS | 67% | 77% |
| Standard treatment guidelines availability | 86% | 97% | |
| QPV | Product Quality Assurance/control guidelines or manual or SOPs availability | 18% | 59% |
| Department/unit responsible for implementing the pharmacovigilance strategy/procedure | 35% | 62% | |
| Standard operating procedures (SOPs) for pharmacovigilance availability | 30% | 61% | |
| WS | Standard operating procedures (SOPs) for Warehousing & Storage availability | 69% | 85% |
| Warehouse room temperature recorded and up to date | 41% | 55% | |
| Facility updates bin cards for all products | 71% | 87% | |
| DIS | Temperature monitoring devices used to track temperature excursions during transportation | 17% | 36% |
| LM | Policies in place that guide the paper LMIS | 79% | 93% |
| Policies in place that guide the electronic LMIS (eLMIS) | 37% | 60% | |
| Conduct internal data quality assessments (DQA) | 24% | 33% | |
| WM | Unusable pharmaceutical products stored separately | 89% | 91% |
| PS | The facility established DTC | 95% | 96% |
| The DTC conducted medicine use evaluation | 24% | 25% | |
| Pharmacists conduct pharmacy-only rounds and/or morning session | 61% | 64% | |
| Standard operating procedure (SOP) for provision of DIS availability | 24% | 94% | |
| The DIS prepare and disseminate performance reports monthly | 13% | 55% | |
| ASP Team established | 37% | 49% | |
| The facility Categorized antibiotics into Access, Watch and Reserve (AWaRe) | 30% | 33% | |
| The facility designed workflow and renovated for APTS | 92% | 97% | |
| Patient knowledge assessment practice | 28% | 41% | |
| ESC | Unit/team/person to lead and coordinate emergency supply chain efforts | 22% | 46% |
Tracer product availability
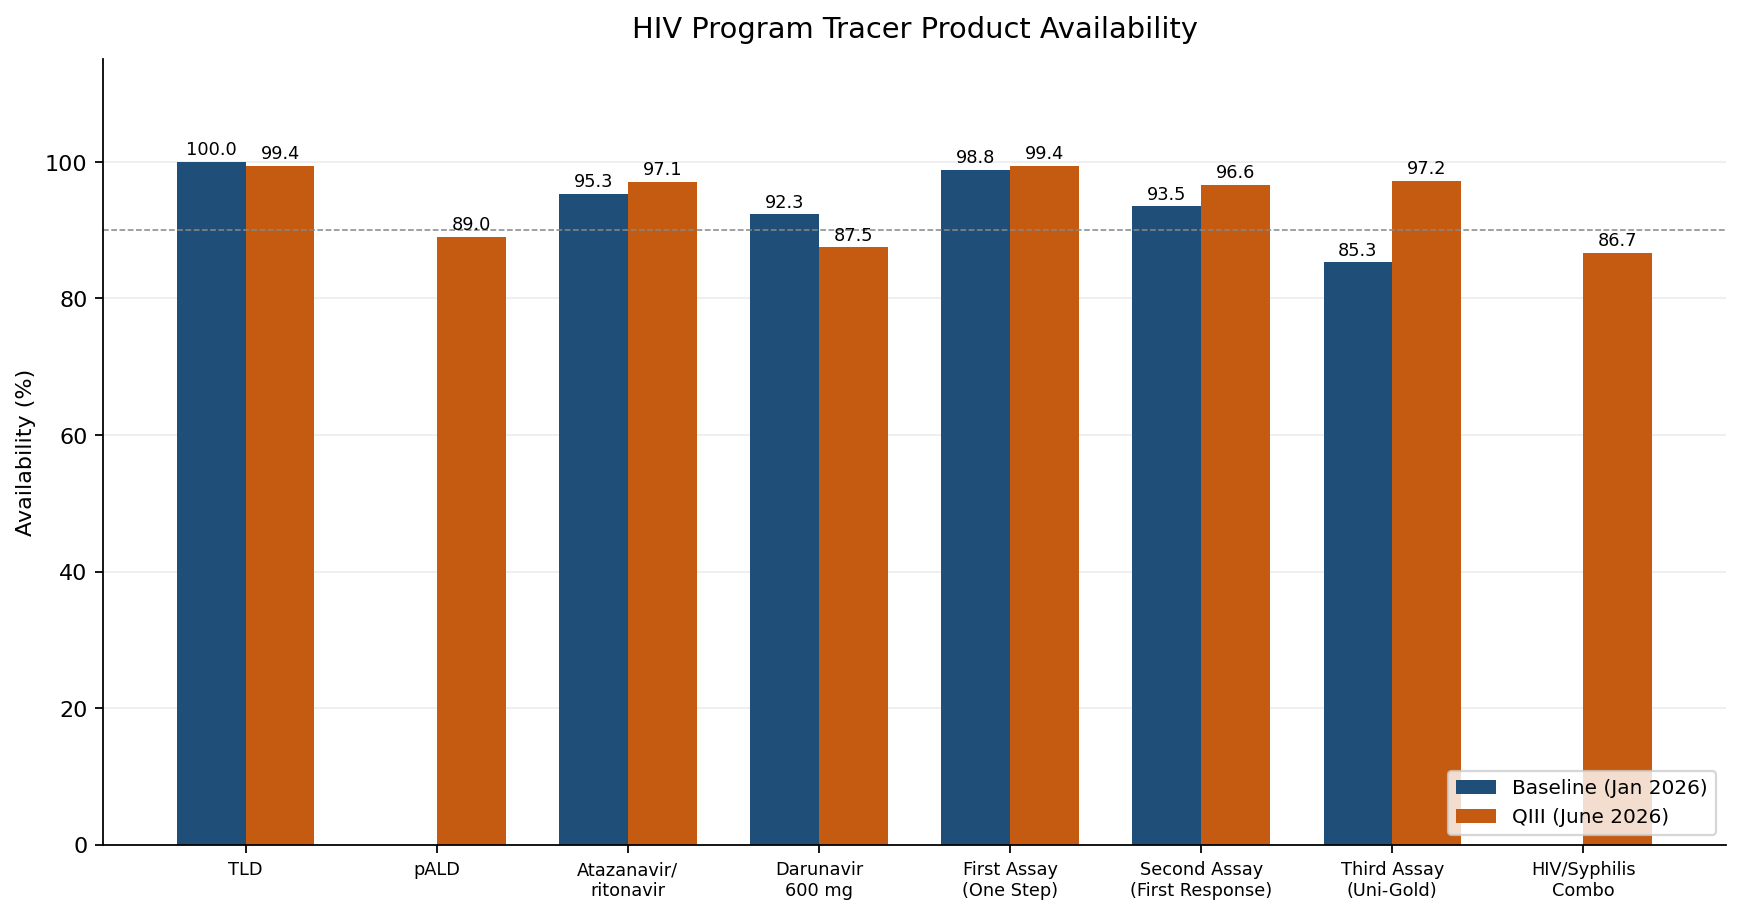
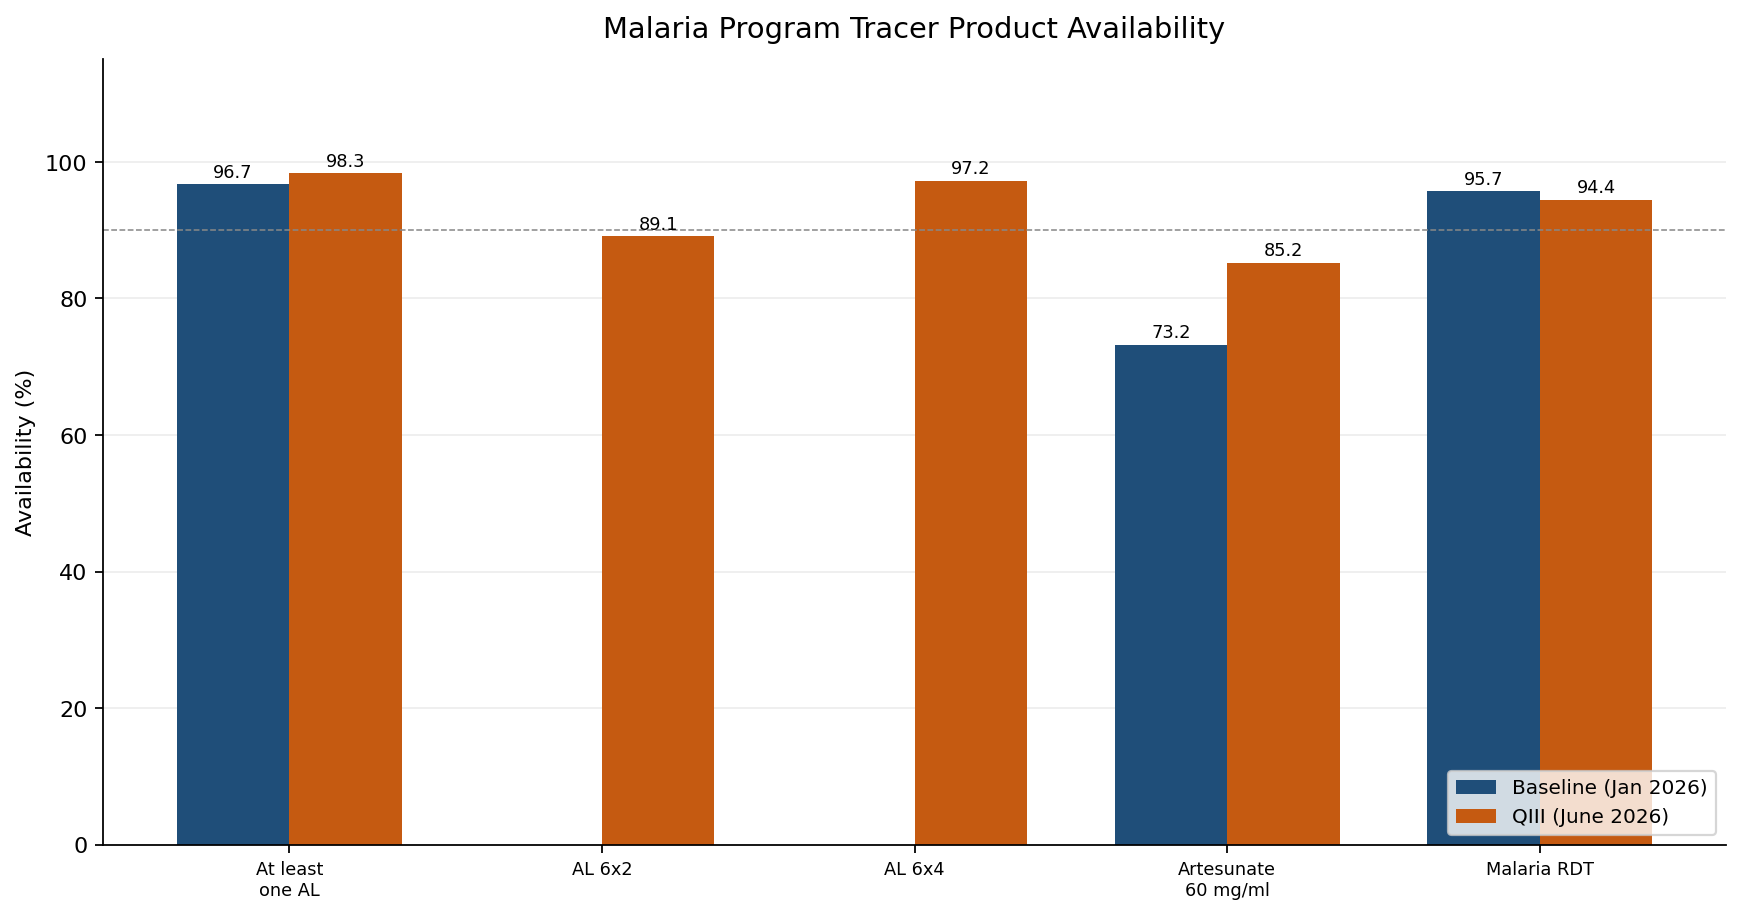
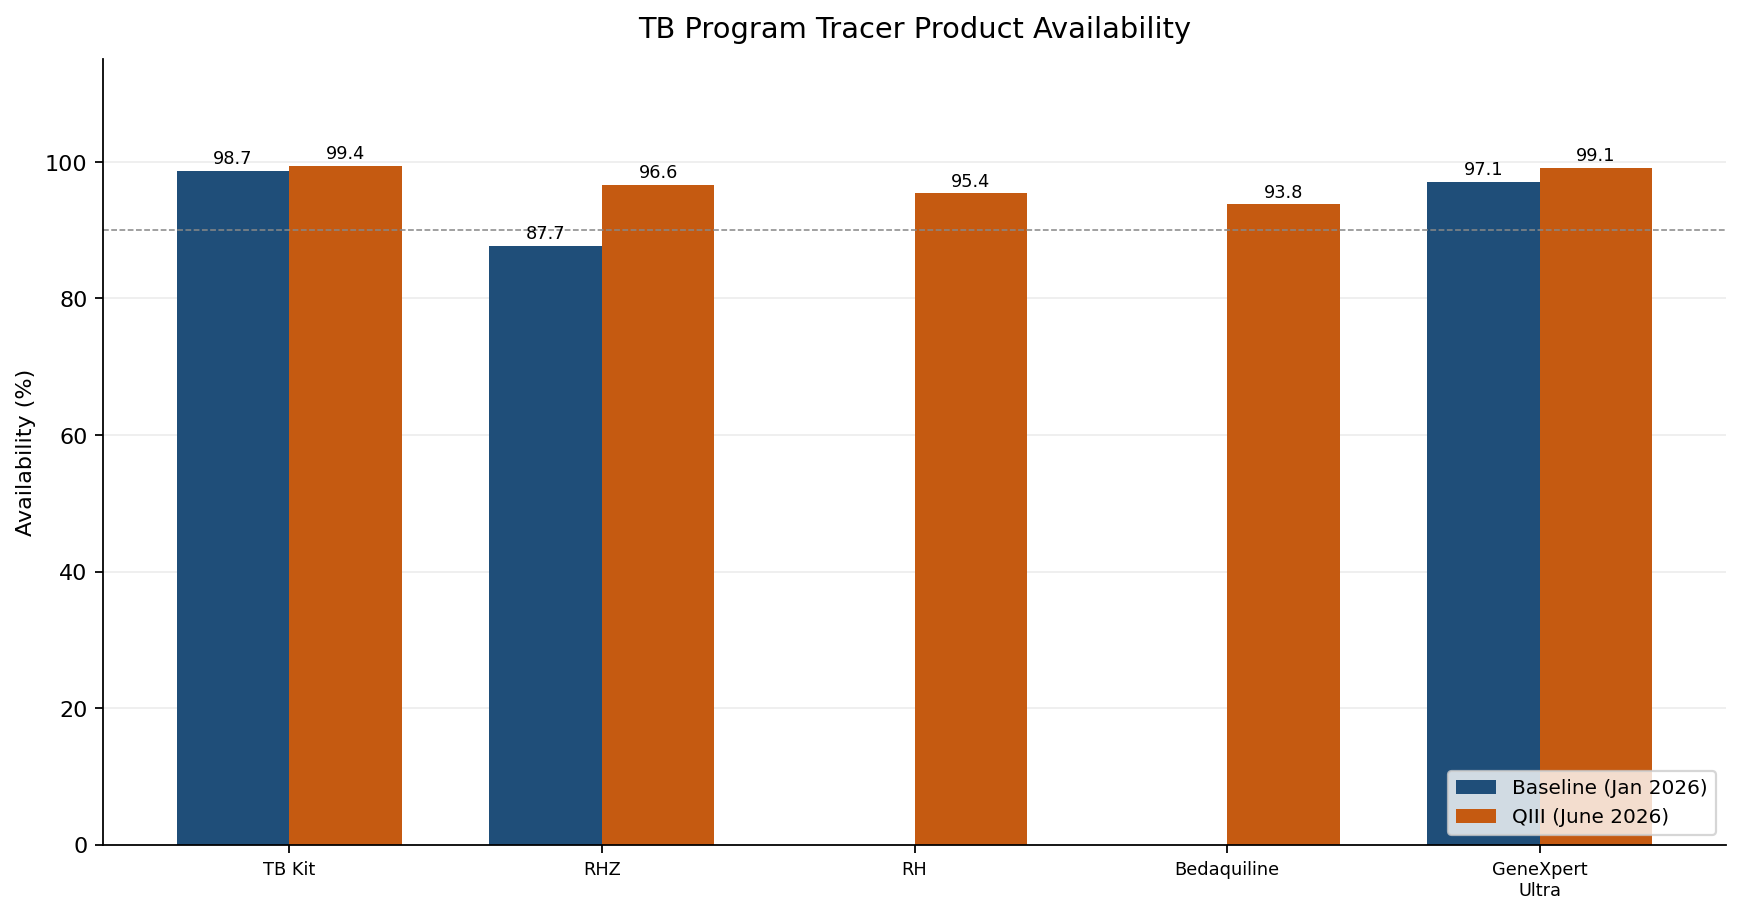
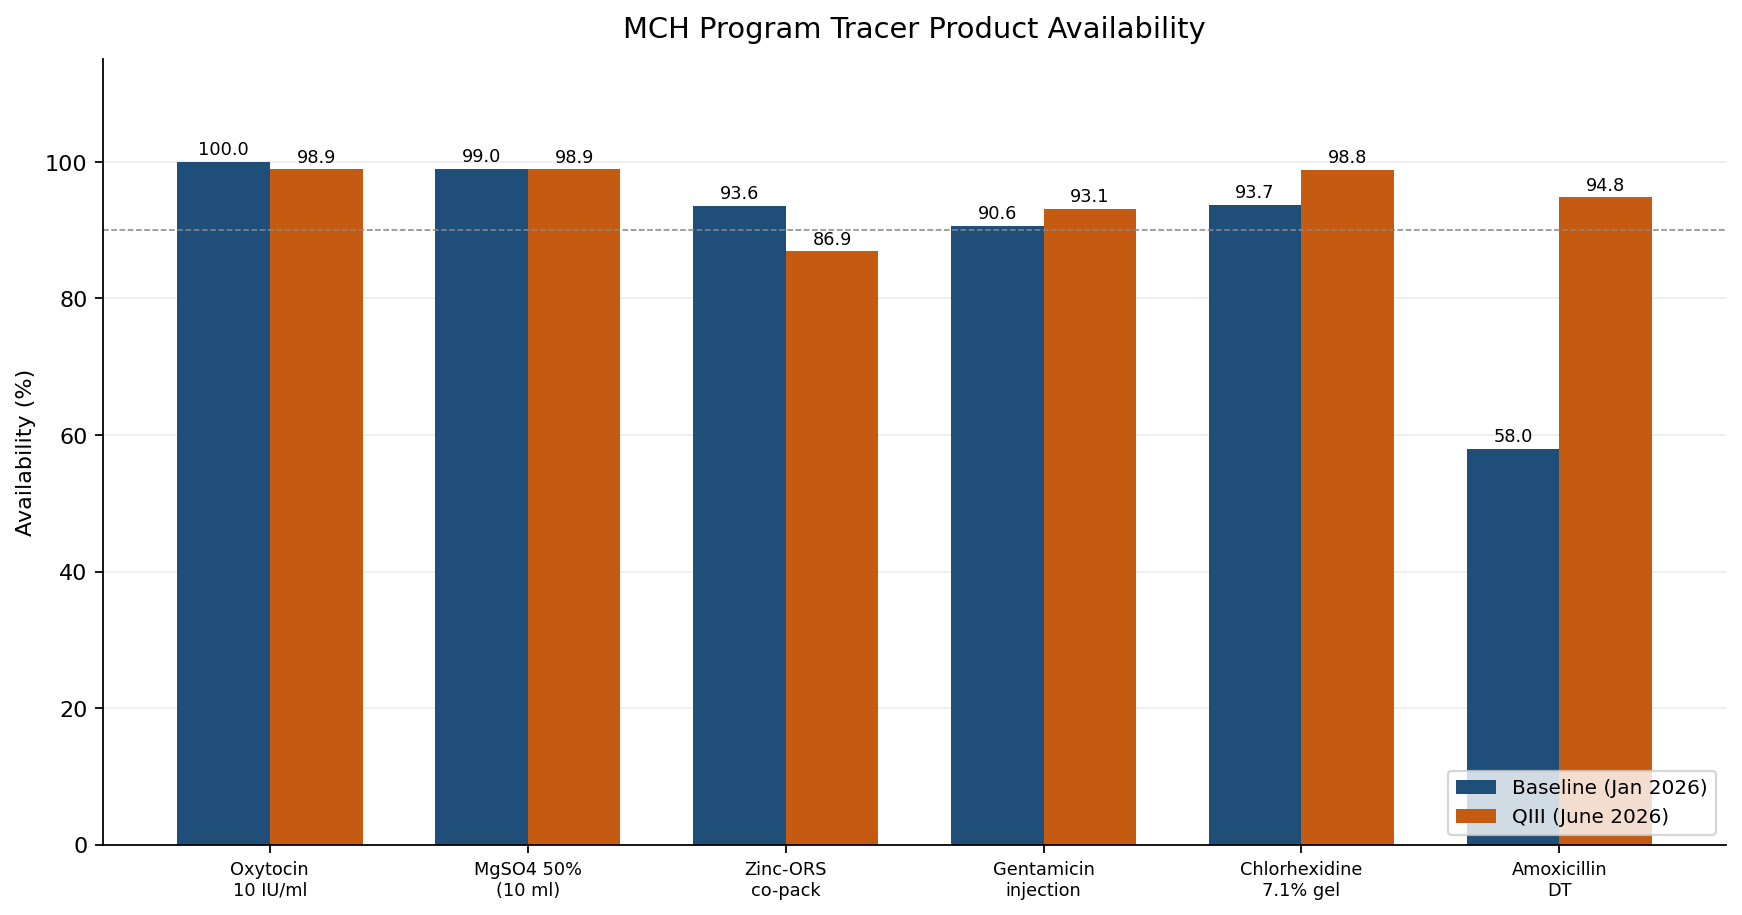
Availability of tracer products remained high and improved across most commodities between baseline and QIII.
HIV program: TLD remained near-universal (100.0% → 99.4%); Atazanavir/ritonavir improved from 95.3% to 97.1%; Darunavir 600 mg declined from 92.3% to 87.5%; pALD reached 89.0% in QIII. Testing commodities were strong, with the Third Assay (Uni-Gold) increasing from 85.3% to 97.2%.
Malaria program: At least one AL formulation increased from 96.7% to 98.3%; Artesunate 60 mg/ml improved from 73.2% to 85.2%; RDT availability remained high with a slight decline (95.7% → 94.4%).
TB program: TB Kit 98.7% → 99.4%; GeneXpert Ultra 97.1% → 99.1%; RHZ 87.7% → 96.6%; RH 95.4% and Bedaquiline 93.8% in QIII.
MCH program: Oxytocin and magnesium sulphate remained near-universal; Chlorhexidine gel 93.7% → 98.8%; Amoxicillin DT 58.0% → 94.8%; Zinc-ORS co-pack declined 93.6% → 86.9%, though loose zinc and ORS were available in all facilities.
Lessons learned
TSTs were more effective than traditional supervision in improving pharmaceutical supply chain and pharmacy service performance. Maturity-based classification enabled efficient targeting of technical assistance. Continuous mentorship and on-site coaching strengthened staff capacity and promoted sustainable improvements. Routine data use during supportive supervision enhanced accountability and evidence-based decision-making. Strong collaboration among MSH, U3, RHBs, and facility teams — with active facility leadership engagement — was critical for ownership and sustainability.
Cost-effectiveness
The TST model concentrates technical and supervisory resources on priority facilities based on need and performance gaps, rather than applying broad, non-targeted supervision. This reduces inefficient use of time and resources, minimizes repetitive routine visits, accelerates improvement cycles, and improves return on investment within available human and financial resources.
Sustainability
Sustainability is supported through continuous capacity building of facility pharmacy staff; integration of improvement plans into routine operations; alignment with government-led supportive supervision and monitoring systems; and promotion of a strong data-use culture that strengthens evidence-based decision-making and ongoing performance management.
Recommendations and way forward
- Scale up the TST approach nationwide with standardized implementation across regions.
- Strengthen digital dashboards for real-time monitoring and timely decision-making.
- Institutionalize TST functions within regional health systems to promote ownership.
- Integrate the maturity framework into national supportive supervision systems.
- Secure sustained financing to ensure continuity of technical assistance and system strengthening.